
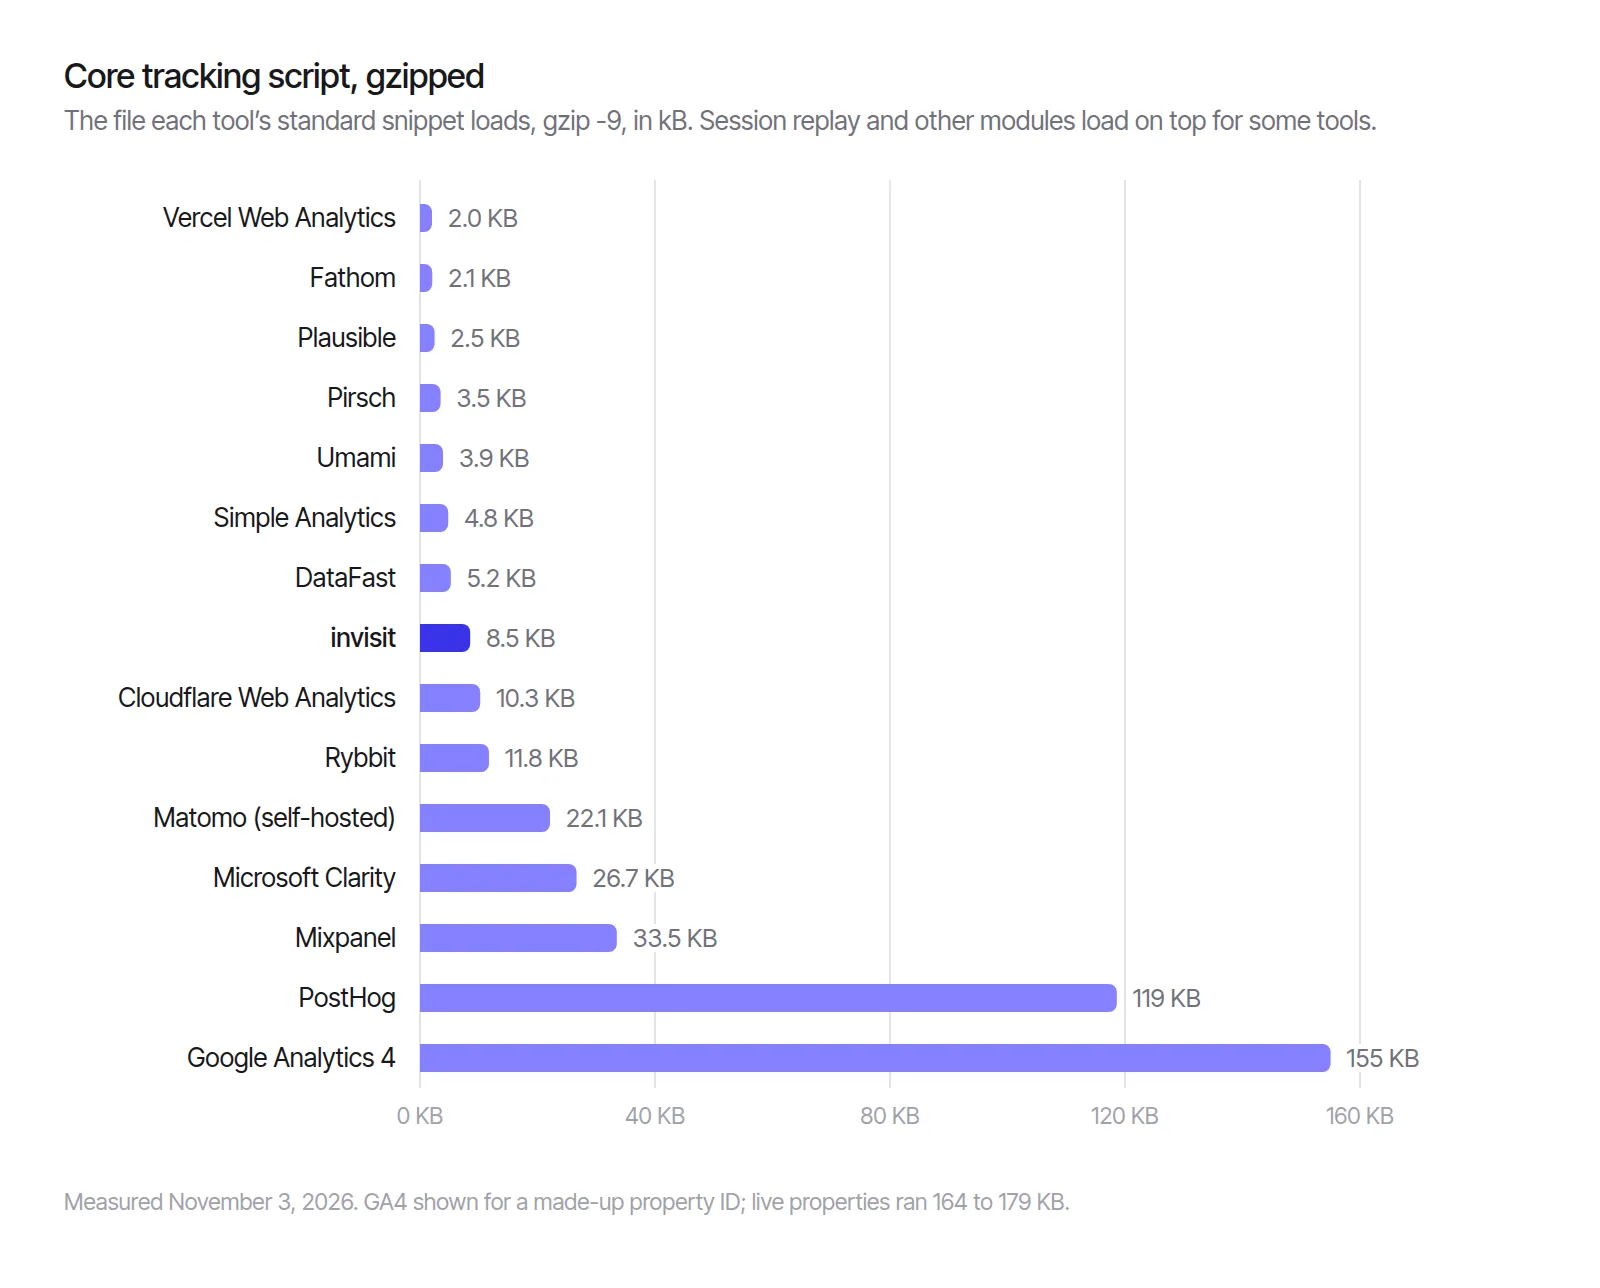
On November 3, 2026, the tracking scripts of 15 web analytics tools ranged from 1.3 KB to 179 KB gzipped. Plausible’s legacy script.js was the smallest, and Google Analytics 4’s gtag.js the largest: 155 KB for a made-up ID and up to 179 KB for a live property.
Most privacy-focused trackers sit between 2 and 12 KB. Session recording and product analytics tools run from 27 KB (Clarity) to 119 KB (PostHog), and several of them download more code later for session replay and surveys. invisit, the tool we build, loads about 8.5 KB, which puts it in the middle: seven tools in this test are lighter (Plausible, Vercel, Fathom, Pirsch, Umami, Simple Analytics and DataFast) and seven are heavier (Cloudflare, Rybbit, Matomo, Clarity, Mixpanel, PostHog and GA4).
Below are the full table, what those bytes cost a visitor, what loads later, what the smaller scripts leave out, and the commands to reproduce every number. KB means 1,000 bytes throughout.
Analytics script sizes compared (November 2026)
Across the 15 tools, the core analytics script ran from 1,285 bytes gzipped (Plausible’s legacy script.js) to 178,838 bytes (GA4’s gtag.js for a live property). The table lists the file each tool’s standard snippet loads, measured four ways, in bytes: raw (what the browser parses), gzip at level 9 and brotli at quality 11 (two references that compare files fairly), and what the vendor’s server actually sent to a client accepting the encodings Chrome accepts. Rows are sorted by gzip size.
| Tool | File | Raw | Gzip -9 | Brotli 11 | Sent to Chrome |
|---|---|---|---|---|---|
| Plausible (legacy) | script.js |
2,841 | 1,285 | 1,122 | 1,361 (zstd) |
| Vercel Web Analytics | script.js |
4,522 | 2,033 | 1,834 | 2,076 (br) |
| Fathom | script.js |
6,981 | 2,086 | 1,793 | 2,283 (zstd) |
| Plausible (per-site) | pa-*.js |
5,972 | 2,485 | 2,193 | 2,658 (zstd) |
| Pirsch | pa.js |
11,842 | 3,498 | 3,041 | 3,723 (zstd) |
| Umami | script.js |
8,575 | 3,913 | 3,533 | 4,099 (br) |
| Simple Analytics | latest.js (v12) |
9,611 | 4,793 | 4,299 | 5,147 (zstd) |
| DataFast | script.js |
15,376 | 5,250 | 4,618 | 5,456 (br) |
| invisit | invisit.js |
20,330 | 8,542 | 7,720 | 7,720 (br) |
| Cloudflare Web Analytics | beacon.min.js (2026.10.1) |
31,853 | 10,253 | 9,322 | 10,264 (gzip) |
| Rybbit | script.js |
37,351 | 11,753 | 10,599 | 12,118 (gzip) |
| Matomo, self-hosted | matomo.js (5.14.2) |
68,294 | 22,132 | 19,293 | Your server decides |
| Microsoft Clarity | loader + clarity.js (0.8.75) |
73,982 | 26,669 | 23,507 | 25,870 (none + br) |
| Mixpanel | mixpanel-2-latest.min.js (2.84.0) |
103,263 | 33,511 | 29,552 | 33,589 (gzip) |
| Matomo Cloud | matomo.js (public demo) |
225,180 | 65,427 | 56,199 | 62,782 (br) |
| PostHog | array.js (1.445.0) |
369,516 | 118,618 | 99,716 | 118,879 (br) |
| Google Analytics 4 | gtag.js, made-up ID |
445,931 | 154,992 | 128,985 | 156,756 (zstd) |
| Google Analytics 4 | gtag.js, five live properties |
481,663 to 542,687 | 163,538 to 178,838 | 136,030 to 148,217 | 166,033 to 181,330 (zstd) |
The five live GA4 properties are the ones on tailwindcss.com, docusaurus.io, eslint.org, pnpm.io and prettier.io. The Clarity row adds a live project’s 726-byte loader to clarity.js. Self-hosted Matomo comes from the 5.14.2 release on GitHub, so its transfer size depends on how your own server compresses it. Plausible replaced script.js with a per-site pa-*.js file in October 2025 (Plausible’s update guide); the old file is still served, and we measured the new one Plausible uses on its own site.
Why are GA4, PostHog and Mixpanel scripts so big?
The large analytics scripts are not page-view counters. Each carries a tag runtime, a product suite or a session recorder, and every visitor downloads it on the first page view.
- Google Analytics 4:
gtag.jsis the Google tag runtime with your property’s configuration embedded; the file opens with adataobject holding the property’s tags. That is why its size depends on the measurement ID: 155.0 KB gzipped for a made-up ID, 163.5 to 178.8 KB for the five live properties. Two requests for the same ID minutes apart had the same raw size but were not byte-identical. - PostHog:
array.js(posthog-js 1.445.0) is the full browser SDK, with autocapture, feature flags and the loaders for the rest of the suite, at 118.6 KB. - Mixpanel: the CDN build (2.84.0) tracks events, autocaptures clicks and forms (Mixpanel’s JavaScript docs) and decides when to fetch the replay recorder, at 33.5 KB.
- Matomo:
matomo.js5.14.2 is the full tracking client, with goals, ecommerce and content tracking, at 22.1 KB. On Matomo Cloud the same file also carries the trackers of premium features: the public demo instance serves 65.4 KB with heatmap and session recording, media, form, crash and A/B testing code inside. - Microsoft Clarity:
clarity.jsis the recorder itself; Microsoft describes clarity-js as code that “tracks user interactions as well as layout changes” (Clarity on GitHub), and Clarity is built around session recordings and heatmaps. - Cloudflare Web Analytics:
beacon.min.jsmeasures Core Web Vitals and breaks LCP and INP into their sub-parts (Cloudflare’s docs), at 10.3 KB. - Rybbit:
script.jsbundles web vitals, error tracking, click, copy and form tracking and feature flags; only session replay loads separately (Rybbit’s proxy guide).
What does a heavier analytics script cost your visitors?
A heavier analytics script costs a visitor three things: the bytes over the network, the work to parse and compile them, and the main-thread time to run them. Under about 12 KB all three are small. At 100 KB and up they add up on slow connections and slow phones.
Download time
Here is simple arithmetic at Lighthouse’s default mobile profile, 1.6 Mbps down with a 150 ms round trip (Lighthouse throttling docs): the bytes actually sent, times eight, divided by 1.6 Mbps.
| Script | Bytes sent | Transfer at 1.6 Mbps |
|---|---|---|
gtag.js, largest live property |
181,330 | 0.89 s |
gtag.js, made-up ID |
156,756 | 0.77 s |
PostHog array.js |
118,879 | 0.58 s |
| Mixpanel | 33,589 | 0.16 s |
Cloudflare beacon.min.js |
10,264 | 0.05 s |
invisit.js |
7,720 | 0.04 s |
Plausible pa-*.js |
2,658 | 0.01 s |
Analytics snippets normally load with async or defer, so this download does not block the HTML parser. On a slow connection, those bytes still take bandwidth the rest of the page is waiting for.
Every analytics script from a third-party host also needs a connection to that host first, and setting one up “might involve up to three round trips” (web.dev). At a 150 ms round trip, three round trips are 450 ms, the same for a 1 KB file as for a 180 KB one. Serving the script from your own domain removes that setup; Plausible, Rybbit and invisit each document a proxy (Plausible, Rybbit, invisit).
Parse and compile
Chrome’s V8 engine can parse and compile a downloaded script “without blocking the main thread”, and the V8 team wrote in 2019 that “the dominant costs of processing scripts are now download and CPU execution time” (V8 blog). From the third load on, V8 can skip compiling by reusing a code cache, but only while the file keeps coming from the HTTP cache or a 304 Not Modified; a fresh 200 response “clears the code cache” (V8’s code caching guide). That ties compile cost to the cache lifetimes further down.
Main-thread execution
Running the code happens on the main thread, where any task over 50 ms is a long task that delays the next click or tap (web.dev). Interaction to Next Paint, the Core Web Vital for responsiveness, is good at 200 ms or less at the 75th percentile (web.dev), and Lighthouse flags third-party code that blocks the main thread for 250 ms or more (Chrome docs).
We did not measure CPU time. It depends on the device and on what each script does, which file size only hints at. A session recorder, for one, serializes the whole page and then records every change and interaction (rrweb’s README), work a page-view counter never does.
Said plainly: the gap between a 2 KB and a 9 KB tracker is about 35 ms of transfer at 1.6 Mbps. The gap between 9 KB and 180 KB is most of a second at the same speed, plus 446 to 543 KB of uncompressed JavaScript for the phone to compile and run.
Gzip, brotli or on the wire: which script size is the real one?
The size a visitor pays for is the on-the-wire size, the bytes the browser receives. Gzip -9 and brotli 11 are references for comparing files fairly. The three differ because the algorithms differ, and because each server picks its own encoding and compression level.
- Gzip’s deflate looks back at most 32 KB for repeated text (RFC 1951). Brotli can look back up to 16 MiB and has a built-in dictionary of 122,784 bytes of common strings (RFC 7932). On every core script here, brotli 11 came out 9 to 17% smaller than gzip -9.
- The gap grows on large files whose repeats sit far apart. Mixpanel’s replay recorder is 104.6 KB with gzip and 62.7 KB with brotli, 40% smaller. With brotli’s window capped at 32 KB we got 95.2 KB, so most of that gain is the longer reach. Umami’s recorder (35%) and Rybbit’s (29%) show the same pattern.
- The server decides what is sent. Mixpanel’s CDN answered our Chrome-like request with gzip, so a recorded visitor downloads the 104.7 KB version. Google sent
gtag.jsas zstd, which Chrome supports since version 123 (Chrome blog, RFC 8878), at 1.1 to 1.5% more than gzip -9. - Servers that compress on the fly use faster settings. Umami’s recorder arrived as 45.5 KB of brotli, 20% more than at quality 11. invisit precompresses at quality 11, so its sent size equals its brotli column.
- Raw size never goes away. The browser decompresses before parsing, so V8 works through the 446 to 543 KB of
gtag.js, not the 157 to 181 KB that crossed the network.
When a vendor quotes a script size, check which of these it is before you compare it with anything.
Which analytics tools load more code later?
PostHog, Mixpanel, Umami and Rybbit download a separate, often larger file for session replay, and PostHog fetches more files for surveys and other features. invisit loads small modules for web vitals, heatmaps and feedback. These files are not in the main table.
| Tool | File | Loads when | Gzip -9 | Brotli 11 | Sent to Chrome |
|---|---|---|---|---|---|
| PostHog | lazy-recorder.js |
Session replay is on | 68,449 | 59,144 | 69,970 (br) |
| PostHog | surveys.js |
Surveys are on | 47,076 | 41,342 | 47,507 (br) |
| PostHog | product-tours.js |
Product tours are on | 40,676 | 36,034 | 41,740 (br) |
| PostHog | conversations.js |
Conversations are on | 23,754 | 21,242 | 24,820 (br) |
| PostHog | dead-clicks-autocapture.js |
Dead click capture is on | 8,517 | 7,777 | 8,763 (br) |
| PostHog | exception-autocapture.js |
Exception capture is on | 6,544 | 5,937 | 6,841 (br) |
| PostHog | web-vitals.js |
Web vitals are on | 3,941 | 3,594 | 4,086 (br) |
| Mixpanel | mixpanel-recorder-CcIR1Do8.min.js |
A session is picked for replay | 104,614 | 62,743 | 104,699 (gzip) |
| Rybbit | replay.js |
Session replay is on | 81,659 | 58,013 | 85,398 (gzip) |
| Umami | recorder.js |
You add the tag for replays or heatmaps | 58,422 | 37,764 | 45,455 (br) |
| invisit | invisit-extras.js |
Web vitals are on (the default) | 1,116 | 1,019 | 1,019 (br) |
| invisit | invisit-interactions.js |
Heatmaps are on | 1,488 | 1,312 | 1,312 (br) |
| invisit | invisit-feedback.js |
The feedback widget is on | 3,575 | 3,116 | 3,116 (br) |
| invisit | invisit-overlay.js |
You open a heatmap on your own page | 8,623 | 7,740 | 7,740 (br) |
posthog-js 1.445.0 asks for lazy-recorder.js unless the project’s remote config names another bundle; the older recorder.js measured 42.7 KB. Mixpanel’s code fetches its recorder only for sessions picked by record_sessions_percent (0 by default) or a recording already in progress. Umami’s recorder.js is a second script tag you add yourself (Umami’s replay docs), so every visitor downloads it, even though Umami records 15% of sessions by default. Rybbit fetches replay.js when session replay is on for the site.
With replay on, the totals change a lot. In gzip bytes: PostHog with replay and surveys is 234.1 KB, Mixpanel with its recorder 138.1 KB, Rybbit with replay 93.4 KB and Umami with its recorder 62.3 KB. invisit with web vitals, heatmaps and the feedback widget is 14.7 KB, with no session recordings.
All four replay recorders contain rrweb, the open-source recorder. Clarity is the exception, and it deserves the credit: its 26.2 KB clarity.js is the smallest file in this test that records sessions.
What does a smaller analytics script give up?
A smaller analytics script gives up features. The lightest trackers count page views, referrers, campaigns and custom events; heatmaps, session replay, web vitals and funnels are what push the size up. Match the script to the features you will use, not to the lowest number in the table.
Under 3 KB: Plausible, Vercel and Fathom.
- Plausible has custom events on every plan, funnels and custom properties on Business, scroll depth, and no heatmaps, session recordings or web vitals (our Plausible comparison).
- Vercel Web Analytics has custom events on Pro and Enterprise only, no funnels, heatmaps or replay, and leaves web vitals to a separate product, Speed Insights (our Vercel comparison).
- Fathom’s events carry a name and an optional value, with no custom properties, funnels, heatmaps, replay or web vitals (our Fathom comparison).
3 to 6 KB: Pirsch, Umami, Simple Analytics and DataFast.
- Pirsch records outbound link clicks and file downloads automatically (Pirsch docs).
- Umami has funnels, sessions and opt-in web vitals; heatmaps and replays need the 58.4 KB recorder and the Business plan or a self-hosted install (our Umami comparison).
- Simple Analytics has events and multi-step goals, with scroll depth but no heatmaps, replay or web vitals (our Simple Analytics comparison).
- DataFast has goals and funnels with revenue at each step, and no heatmaps, replay or web vitals (our DataFast comparison).
8 to 12 KB: invisit, Cloudflare and Rybbit.
- invisit records page views including single-page app navigation, outbound links and downloads, custom events with up to 32 properties, events from HTML attributes, conversions, funnels and signed-in users. Web vitals (1.1 KB) and click and scroll heatmaps (1.5 KB) are separate modules. It has no session recordings (events guide).
- Cloudflare Web Analytics is available on every Cloudflare plan and centers on Core Web Vitals, with LCP and INP broken into sub-parts (Cloudflare’s docs).
- Rybbit carries web vitals, error tracking, click, copy and form tracking and feature flags in its main file, with replay as an 81.7 KB extra on its Pro plan (Rybbit’s site settings).
20 KB and up: Matomo, Clarity, Mixpanel, PostHog and GA4. These carry visit logs, product analytics, recordings or an ad platform: Matomo’s visits log and Cloud heatmaps (our Matomo comparison), Clarity’s free recordings and heatmaps, Mixpanel’s autocapture and replay (our Mixpanel comparison), PostHog’s flags, experiments and surveys (our PostHog comparison), and GA4’s funnel explorations and Google Ads and BigQuery links (our GA4 comparison). If GA4 is the one you are replacing, start with Google Analytics alternatives.
How long does the browser cache each analytics script?
Analytics scripts stay in the browser cache for anything from zero seconds to 31 days, set by each vendor’s Cache-Control header. Since Chrome 86 the HTTP cache is partitioned by site, so a copy cached while visiting another site never helps yours (Chrome blog).
| Cache-Control we received | Scripts |
|---|---|
| 31 days | Vercel |
| 8 days | Matomo Cloud demo |
| 7 days | Simple Analytics |
| 1 day | Plausible script.js, Umami, Cloudflare, Pirsch, clarity.js |
| 4 hours | PostHog |
| 1 hour | invisit, Rybbit |
| 15 minutes, private, no ETag | GA4 gtag.js |
| 10 minutes | Mixpanel |
| 60 seconds | Plausible pa-*.js |
| 0, revalidated with an ETag | Fathom, DataFast |
| no-store | Clarity loader (726 bytes, every page view) |
A short lifetime with an ETag or Last-Modified date costs little: the browser asks, gets a 304 Not Modified, and V8 keeps its compiled code. GA4’s gtag.js came with neither, so after 15 minutes the next page view downloads the full 157 to 181 KB again, and that fresh response clears V8’s code cache.
These script sizes will drift
Vendors ship tracker updates every few days, so treat these numbers as a snapshot of November 3, 2026, and re-run the commands below before you quote one.
The Last-Modified headers we received show it. PostHog’s array.js and all its extra files changed at 10:52 UTC that morning, 48 minutes before we fetched array.js, and Vercel’s script at 10:43 UTC. Umami’s script and recorder, DataFast’s script and Clarity’s clarity.js changed the day before, Rybbit’s on November 1. Our own PostHog comparison, written earlier the same day, recorded posthog-js 1.444.4; we measured 1.445.0.1
How we measured the scripts
We fetched every file on November 3, 2026, between 11:35 and 11:50 UTC, from one machine with a Chrome 141 user agent.
- Download each file with
curl --compressedand count its bytes: that is the raw size. - Compress it with GNU gzip 1.14 at
-9 -n(-nkeeps the file name out of the header) and with brotli at quality 11 through Bun’snode:zlib, since no brotli CLI was installed. - Download it again with
Accept-Encoding: gzip, deflate, br, zstd, keep the bytes as sent, and read thecontent-encodingandcache-controlheaders. - Take the URLs of the extra files from each main script’s own code, and fetch them the same way.
#!/usr/bin/env bash
# Usage: ./measure.sh <script URL>
set -euo pipefail
url=$1
ua='Mozilla/5.0 (X11; Linux x86_64) AppleWebKit/537.36 (KHTML, like Gecko) Chrome/141.0.0.0 Safari/537.36'

# The file as the browser parses it, decompressed
curl -sSL -A "$ua" --compressed -o script.js "$url"
echo "raw:    $(wc -c < script.js)"
echo "gzip:   $(gzip -9 -n -c script.js | wc -c)"
echo "brotli: $(bun brotli.ts script.js)"

# What the server sends to a browser that accepts what Chrome accepts
curl -sSL -A "$ua" -H 'Accept-Encoding: gzip, deflate, br, zstd' -D headers.txt -o wire.bin "$url"
echo "wire:   $(wc -c < wire.bin)"
grep -i -E '^(content-encoding|cache-control|last-modified):' headers.txtimport { brotliCompressSync, constants } from 'node:zlib'
const bytes = await Bun.file(process.argv[2]!).bytes()
const brotli = brotliCompressSync(bytes, { params: { [constants.BROTLI_PARAM_QUALITY]: 11 } })
console.log(brotli.byteLength)If you have the brotli CLI, brotli -q 11 -c script.js | wc -c replaces the Bun step. These are the URLs we fetched:
| Tool | URL | Version or date in the file or headers |
|---|---|---|
| Plausible (legacy) | https://plausible.io/js/script.js |
None |
| Plausible (per-site) | https://plausible.io/js/pa-6_srOGVV9SLMWJ1ZpUAbG.js |
None; plausible.io’s own site |
| Vercel Web Analytics | https://nextjs.org/_vercel/insights/script.js |
0.1.3 in the file |
| Fathom | https://cdn.usefathom.com/script.js |
Last-Modified August 20, 2026 |
| Pirsch | https://api.pirsch.io/pa.js |
Last-Modified October 29, 2026 |
| Umami | https://cloud.umami.is/script.js and /recorder.js |
Last-Modified November 2, 2026 |
| Simple Analytics | https://scripts.simpleanalyticscdn.com/latest.js |
v12, dated 2026-10-22 in its header |
| DataFast | https://datafa.st/js/script.js |
Last-Modified November 2, 2026 |
| invisit | https://api.invisit.dev/invisit.js and invisit-*.js beside it |
Production build of November 3, 2026 |
| Cloudflare | https://static.cloudflareinsights.com/beacon.min.js |
2026.10.1 in the file |
| Rybbit | https://app.rybbit.io/api/script.js and /api/replay.js |
Last-Modified November 1, 2026 |
| Matomo | https://raw.githubusercontent.com/matomo-org/matomo/5.14.2/matomo.js |
5.14.2, released October 22, 2026 |
| Matomo Cloud | https://demo.matomo.cloud/matomo.js |
Last-Modified September 28, 2026 |
| Microsoft Clarity | https://www.clarity.ms/tag/<project id> and https://scripts.clarity.ms/0.8.75/clarity.js |
0.8.75 |
| Mixpanel | https://cdn.mxpnl.com/libs/mixpanel-2-latest.min.js and mixpanel-recorder-CcIR1Do8.min.js |
2.84.0 |
| PostHog | https://us-assets.i.posthog.com/static/array.js and /static/<name>.js?v=1.445.0 |
1.445.0 |
| Google Analytics 4 | https://www.googletagmanager.com/gtag/js?id=G-0000000000, then the IDs G-TMR96VNVMT, G-E5CR2Q1NRE, G-7DGPHY308T, G-RPD4HWL84Z and G-T57CP1SG02 |
No version; configuration embedded |
Check the analytics script on your own site
The numbers that matter are the ones your own pages load, with your own settings. Chrome DevTools shows them in a few minutes.
- Open your site in Chrome, open DevTools, go to the Network panel and tick Disable cache, which emulates a first visit (DevTools network reference).
- In the panel settings, turn on Big request rows. The Size column then shows the transferred size on top and the uncompressed size below it.
- Filter by JS, reload, and find your analytics host. Note both sizes and the
content-encodingresponse header. - Use the page for a minute with your features on. Replay recorders, surveys and feedback widgets often arrive after the first page view.
- Run Lighthouse and read “Reduce the impact of third-party code” for the main-thread time.
- You counted every file your configuration loads, not only the main script.
- You compared transferred sizes in one encoding, or gzip -9 against gzip -9.
- You checked Cache-Control on the main script.
- You turned off the features you do not use, so their files stop loading.
Footnotes
-
A new Last-Modified date can also mean a redeploy with unchanged code. PostHog’s version string did change. ↩