
Funnel conversion rates differ between tools because each tool defines a funnel differently: what it counts (users, visits or a daily visitor), how long someone has to finish (one visit, 24 hours, 7 days or no limit), whether they may enter halfway, and how strictly steps must follow each other. We scored the same 12 visitors under seven tools’ default definitions and got conversion rates from 46.2% to 72.7%, and 111% from GA4’s open funnel.
None of those numbers is a bug; the settings pick the question each one answers. This post covers funnel definitions only. Ad blockers, bot filtering and the other reasons dashboards disagree are in why analytics tools show different numbers.
invisit, the analytics tool we build, is one of the seven and gives the lowest rate. Vendor behaviour comes from each vendor’s own documentation or source code, as of November 2026.
The same 12 visitors, scored by seven tools’ funnel definitions
The test funnel has three steps: the page /pricing, the page /signup and the event signup_completed. The date range is Monday 5 to Sunday 18 October 2026 in UTC, and each visitor uses one browser throughout, so every tool can tell them apart.
| Visitor | What they did (times in UTC) |
|---|---|
| Ana | 6 Oct, 10:00: /, /pricing, /signup, signup_completed, all within 5 minutes |
| Ben | 6 Oct, 11:00: /pricing, /signup, then left |
| Cleo | 7 Oct, 09:00: /pricing only |
| Dev | 7 Oct, 14:00: /signup from a newsletter link, signup_completed 3 minutes later, never /pricing |
| Eli | 8 Oct, 16:00: /signup, back to /pricing, /signup again, signup_completed, in 6 minutes |
| Fay | 8 Oct, 20:00: /pricing, 8 minutes on /docs, /signup, signup_completed |
| Gus | 5 Oct, 19:00: /pricing, /signup; back on 6 Oct, 15:00: /signup, signup_completed |
| Hana | 12 Oct: /pricing; 16 Oct: /signup, signup_completed |
| Ivan | 6 Oct and again 15 Oct: /pricing, /signup, signup_completed, 4 minutes each time |
| Jo | 5 Oct: /pricing; 13 Oct: /pricing, /signup, signup_completed |
| Kai | 9 Oct, 13:00: /pricing, /signup; signup_completed 42 minutes later, from the confirmation email |
| Nia | 10 Oct, 10:00: /signup, signup_completed, then /pricing |
Each tool’s default definition, applied to those events:
| Definition | Entered /pricing |
Reached /signup |
Completed | Conversion |
|---|---|---|---|---|
| invisit: visits, one visit | 13 | 9 | 6 | 46.2% |
| Plausible: daily visitor, 24 hours | 13 | 9 | 7 | 53.8% |
| Umami: monthly visitor, 60 minutes between steps | 11 | 8 | 6 | 54.5% |
| Amplitude: users, 1 day | 11 | 8 | 7 | 63.6% |
| Mixpanel: unique users, 7 days | 11 | 8 | 7 | 63.6% |
| PostHog: users, 14 days | 11 | 9 | 8 | 72.7% |
| GA4 funnel exploration: closed, no time limit | 11 | 9 | 8 | 72.7% |
| Mixpanel Totals, 7 days (not the default) | 13 | 10 | 9 | 69.2% |
| GA4 funnel exploration: open | 9 | 11 | 10 | 111.1% |
Conversion is completions divided by entries at the first step.
How we scored it: each definition is a short TypeScript function, written from the vendor’s documentation (and for Plausible, Umami and PostHog, from their open-source code too) and run with Bun. For invisit we also ran the funnel query from our codebase, unchanged, on the same events in ClickHouse: 13, 9 and 6. Then we sent Kai, Nia and a visitor who converts in 4 minutes through a local development copy of invisit, and its API reported 3, 2 and 1, as predicted. Matomo is not scored: its Funnels plugin is closed source, and its docs do not say how it treats steps done out of order.
What moved the numbers:
- Ivan converted twice: one person, but two visits in invisit and two visitor-days in Plausible, so both start from 13 entries, not 11.
- Jo opened
/pricing8 days before signing up. Mixpanel judges a user’s first entry by default, and its 7-day window had closed. Amplitude keeps a user’s longest path and counts her, but loses Hana, who took 4 days against its 1. Same 63.6%, different converters. - Gus came back 20 hours after
/pricing. Amplitude, Mixpanel, PostHog and GA4 count him. Plausible (a new visitor id after midnight UTC), Umami (60 minutes between steps) and invisit (a new visit) stop him at/signup. - Kai paused 42 minutes before
signup_completed. Only invisit loses him: an invisit visit ends after 30 minutes without activity. - Dev never opened
/pricing, and Eli and Nia opened/signupfirst. Closed funnels ignore Dev. GA4’s open funnel enters all three at/signupand ignores their later/pricingviews, so it ends with 10 completions from 9 visitors at step one. - Nia signed up, then read the pricing page. Every closed funnel counts her as lost after
/pricing. - Fay spent 8 minutes on
/docsbetween steps. Every default allows that; a strict-order funnel would not.
How does each tool define a funnel by default?
GA4, Mixpanel, Amplitude and PostHog count users over a time limit measured in days. Plausible, Umami, Matomo and invisit count something shorter-lived: a visit, or a visitor id that resets. That one split explains most of the spread in the test above.
| Tool | Counts | Default time limit | Default order | Who can enter | Repeats |
|---|---|---|---|---|---|
| GA4 funnel exploration | Users | None; optional Within per step | Each step indirectly or directly followed by | Step 1 only; any step with Make open funnel | One entry per user, first sequence reported |
| Mixpanel | Unique users; Totals or Sessions optional | 7 days from step 1, up to 366 days or 12 sessions | Specific Order, other events allowed | Step 1 only | First step 1 in the range; Totals re-enter after each attempt |
| Amplitude | Unique users; event totals optional | 1 day (24 hours, UTC) from step 1, up to 366 days | This order, other events allowed | Step 1 only, inside the range | The earliest longest path per user |
| PostHog | Unique users | 14 days from step 1 | Sequential, other events allowed | Step 1 only | Once per step; any attempt can convert |
| Plausible | Visitors (daily hash) | 24 hours from step 1; the id resets at midnight UTC | Sequential, other activity allowed | Step 1 only | Once per visitor per day |
| Umami | Visitors (monthly hash) | 60 minutes between consecutive steps | In order, other activity allowed | Step 1 only | Once per visitor per month |
| Matomo Funnels | Visits | One visit | In sequence; steps not marked Required can be skipped | Any step, unless the first is Required | Counted per visit |
| invisit | Visits | One visit: 30 minutes idle, 24 hours at most | In order, other activity allowed | Step 1 only | Once per visit per step |
Sources: GA4 funnel exploration. Mixpanel advanced funnels and funnels FAQ. Amplitude interpreting a funnel, how Amplitude computes funnels and funnel FAQ. PostHog funnels, paths and the query defaults. Plausible funnel analysis, data policy and its funnel query. Umami funnel, metric definitions and its funnel query. Matomo required steps, step metrics and what a visit is. The invisit row comes from our code, detailed in how invisit funnels work.
Plausible’s docs state no time limit; the 24 hours are in its funnel query, ClickHouse’s windowFunnel with an 86,400-second window per visitor id. Umami’s 60 minutes is its funnel form’s default. GA4 takes up to 10 steps, Plausible and invisit 2 to 8, Umami at least 2.
Open vs closed funnels
A closed funnel counts only people who start at step 1; an open funnel lets them enter at whichever step they reach first. GA4 funnel explorations are closed unless you switch on Make open funnel, and Matomo lets a visit enter at any step unless the first step is marked Required. The other tools here are closed.
An open funnel follows a user from their first qualifying action. In Google’s example, a user who goes B, A, B, C enters at B, and “if the user navigates back to step 1 after they have entered mid funnel, the action is ignored.” That put Dev, Eli and Nia into our open GA4 funnel at /signup and none of them at /pricing, so step two (11) outgrew step one (9).
Use an open funnel to see traffic through each stage from any entry point, such as a checkout that ads link to. Use a closed one for a conversion rate. If many customers convert before they read your step 1 page, as Nia did, start the funnel later: /signup to signup_completed measures them.
Strict order, any order, and directly or indirectly followed steps
Every default here uses loose order: steps in sequence, anything in between. Strict order allows nothing between two steps, and any order only needs every step done.
| Tool | Loose order (default) | Strict order | Any order |
|---|---|---|---|
| GA4 | Is indirectly followed by | Is directly followed by, per step | Not offered |
| Mixpanel | Specific Order | Not offered | Any Order, with optional anchored steps |
| Amplitude | This order | Exact order | Any order |
| PostHog | Sequential | Strict order | Any order |
| Plausible | Sequential | Strict | Not offered; Flexible needs only the first and last step |
| Umami, invisit | The only mode | Not offered | Not offered |
Strict order rarely fits a website. Plausible warns that in a strict funnel “any other page load or event between two steps breaks the required sequence”, and Google says a directly following step “must occur immediately after the previous step”. A scroll or an autocaptured click between /pricing and /signup then counts as leaving.
Near-simultaneous events are ordered differently too. Mixpanel treats steps within two seconds of each other as interchangeable, Amplitude resolves time to the second unless you switch on millisecond resolution, and invisit orders by millisecond, then by event id.
What is a funnel conversion window?
A funnel conversion window is how long someone has to finish the funnel, counted from step 1 in most tools: 1 day in Amplitude, 7 days in Mixpanel, 14 days in PostHog, no limit in GA4, and 24 hours in Plausible, whose visitor id also resets at midnight UTC. Umami counts each gap instead, 60 minutes from one step to the next. Matomo and invisit count within one visit.
The fine print matters as much as the defaults:
- Amplitude’s day is 24 hours from step 1, in UTC, not a calendar day.
- Mixpanel’s window starts at the first step 1 of an attempt; a later
/pricingview does not restart it. It can also be set in sessions, up to 12. - GA4’s Within limits the time since the previous step, not since step 1.
- Umami’s limit applies to each gap, so a 4-step funnel at 60 minutes can take up to 3 hours.
Gus (20 hours), Hana (4 days) and Kai (42 minutes) are the window cases in our test. Set the window from your own time-to-convert numbers: a signup form takes one sitting, a B2B trial takes weeks.
One-visit and one-day limits come with counting visitors without cookies: a tool that stores nothing on the device knows a visitor only while its hash holds. Our guide to cookieless analytics covers that trade.
Does a funnel count users, sessions or visits?
GA4, Mixpanel, Amplitude and PostHog count users: a person who converts on any counted attempt is one entry and one completion. invisit and Matomo count visits, Plausible counts visitor-days because its id changes daily, and Umami counts visitors by an id built from IP address, user agent and a salt that rotates monthly.
The unit changes both sides of the division. Ivan is one user and two visits; Jo is one converted user, or one lost visit and one converted visit. A per-visit funnel counts every visit that reached step 1 without finishing as a drop-off, even when the person finished on another day, which is why the visit-based rows sit lowest in our test.
Per user answers how many people who saw pricing signed up; per visit, how often a visit that reaches pricing ends in a signup. Mixpanel offers Totals (re-entry after each finished attempt) and Sessions (each qualifying session), and Amplitude can count event totals or hold Session ID constant to count a user once per session.
How do repeated steps and re-entry change a funnel?
Most tools count a person or visit once per step however often they repeat it, but they differ on which attempt they judge:
- GA4: a user enters once per date range and “only the first sequence of steps will be reported”. Elapsed time uses the first occurrence of a repeated step.
- Mixpanel: with Uniques, a user enters at their first step 1 in the range. Totals lets them re-enter after converting or timing out, and Optimized Re-entry counts the user converted if any entry converts.
- Amplitude: the earliest longest path per user, so four searches before one add to cart make one conversion.
- PostHog: someone who starts twice and finishes on the second attempt appears on both steps. The same event used for two steps needs two separate occurrences.
- invisit: a visit counts once at each step. The same page can be two steps of one funnel, and each needs its own view.
Repeats also move time to convert. In invisit, time between steps follows the most recent path through the visit, from the last /pricing view before /signup. We tested a visit with two /pricing views, one /signup and a signup_completed that fired twice, 12 minutes apart: it still counted once, but its time to convert went from 3 minutes to 15. Send a completion event once per signup; our Next.js guide shows where.
Page steps vs event steps
A page step counts an arrival, and an event step counts an action. A /signup page step counts everyone who opened the form; a signup_completed event sent once the account exists counts signups, which is why our test funnel ends on an event.
How a page step matches differs by tool, and a step that matches nothing reads as a 100% drop-off:
- Plausible: a page path or an event. A group of pages like
/blog/*needs a goal first, and for a step at zero, Plausible’s docs say to check that the URL matches “exactly what Plausible records”. - Umami: an exact URL, or a prefix with a trailing wildcard such as
/docs*. - Matomo: Path conditions without query parameters, or URL conditions with them.
- GA4 and PostHog: an event, such as the page view event, with conditions on its parameters, such as the page URL.
- invisit: the exact page path, without query string or fragment and without wildcards, so
/pricing/and/pricingare different steps. An event step matches a custom event or a conversion by name, including events sent from your server.
On a single-page app, page steps also depend on the tracker recording route changes as page views; see single-page apps.
How do time zones and date ranges change funnel numbers?
A funnel’s date range decides which steps it can see. PostHog applies the range to every step: “A later step that happens after the end of the date range doesn’t count, even if it is within the conversion window.” invisit does the same. Amplitude’s FAQ asks only that step 1 falls inside the range, and the rest within the conversion window.
Where every step must fit, the last days of a range look worse, because people who entered then have not had time to finish. Amplitude draws those days as a dotted tail in its conversion-over-time chart.
Midnight matters to funnels bound to a visit. Matomo starts a new visit after midnight in the website’s time zone. On a site where each page is a full page load, invisit starts a new visit at midnight UTC, when its daily visitor hash changes, so a visitor who goes from /pricing at 23:58 to /signup at 00:01 UTC is lost at step 1.
The same tool can disagree with itself across charts. Mixpanel’s line chart runs a separate funnel for each day, so a user can count on several days, while its table counts each user once; Amplitude’s conversion-over-time chart likewise counts a user on each day they enter. In invisit’s dashboard, a range’s days start at midnight in your account’s time zone, and the API takes the range as UTC instants.
GA4 funnel exploration vs Mixpanel funnels
GA4’s funnel exploration and Mixpanel’s funnel report both count users and allow other events between steps, but five defaults differ, enough for 72.7% against 63.6% on our dataset:
- Time limit. GA4 has none unless you add Within to a step, measured from the step before. Mixpanel gives 7 days from step 1.
- Entry. A GA4 funnel can be open or closed; Mixpanel funnels are closed.
- Re-entry. GA4 lets a user enter once and reports the first sequence, with no time limit. Mixpanel’s Uniques also judges the first entry, but within 7 days, which is how it lost Jo while GA4 kept her.
- Order. GA4 sets indirectly or directly followed for each step. Mixpanel offers Specific or Any Order, with a two-second grace period for steps that happen together.
- History. GA4 explorations read user- and event-level data, which a standard property keeps 2 months by default and 14 months at most (data retention), so a funnel over last year can come back empty.
To line them up, give Mixpanel a window as long as your date range and keep GA4 closed with indirectly followed steps; on our dataset, a 14-day Mixpanel window gives GA4’s 72.7%. Recent days can still differ: Mixpanel says merging a user’s anonymous and identified events can take up to 24 hours, so today’s funnel may show someone who converted as dropped off.
How invisit funnels work
invisit funnels are closed, in loose order and bounded by one visit, and they count visits. From the code, as of November 2026:
- Steps: 2 to 8, each a page path or an event name. An event step matches a custom event or a conversion with that name, from the browser or from
@invisitdev/server. - A visit ends after 30 minutes without an event and lasts at most 24 hours. On a site where each page is a full page load, a new visit also starts at midnight UTC.
- Order: each step must come after the one before it in the same visit, with anything in between. Step 1 can be anywhere in the visit, not only the landing page, and one event cannot fill two steps.
- Counting: each visit once per step. The conversion rate is visits that completed divided by visits that reached step 1, with the drop-off at every step.
- Range: every step must fall inside the date range.
- Timing: average and median time between steps and to convert.
- Splits: by the visit’s first referrer, its country or its device; filters keep only the visits that match.
The funnel editor puts it in one line: “A visit counts once it reaches a step after the ones before it, all in that one visit.” Setup is in funnels.
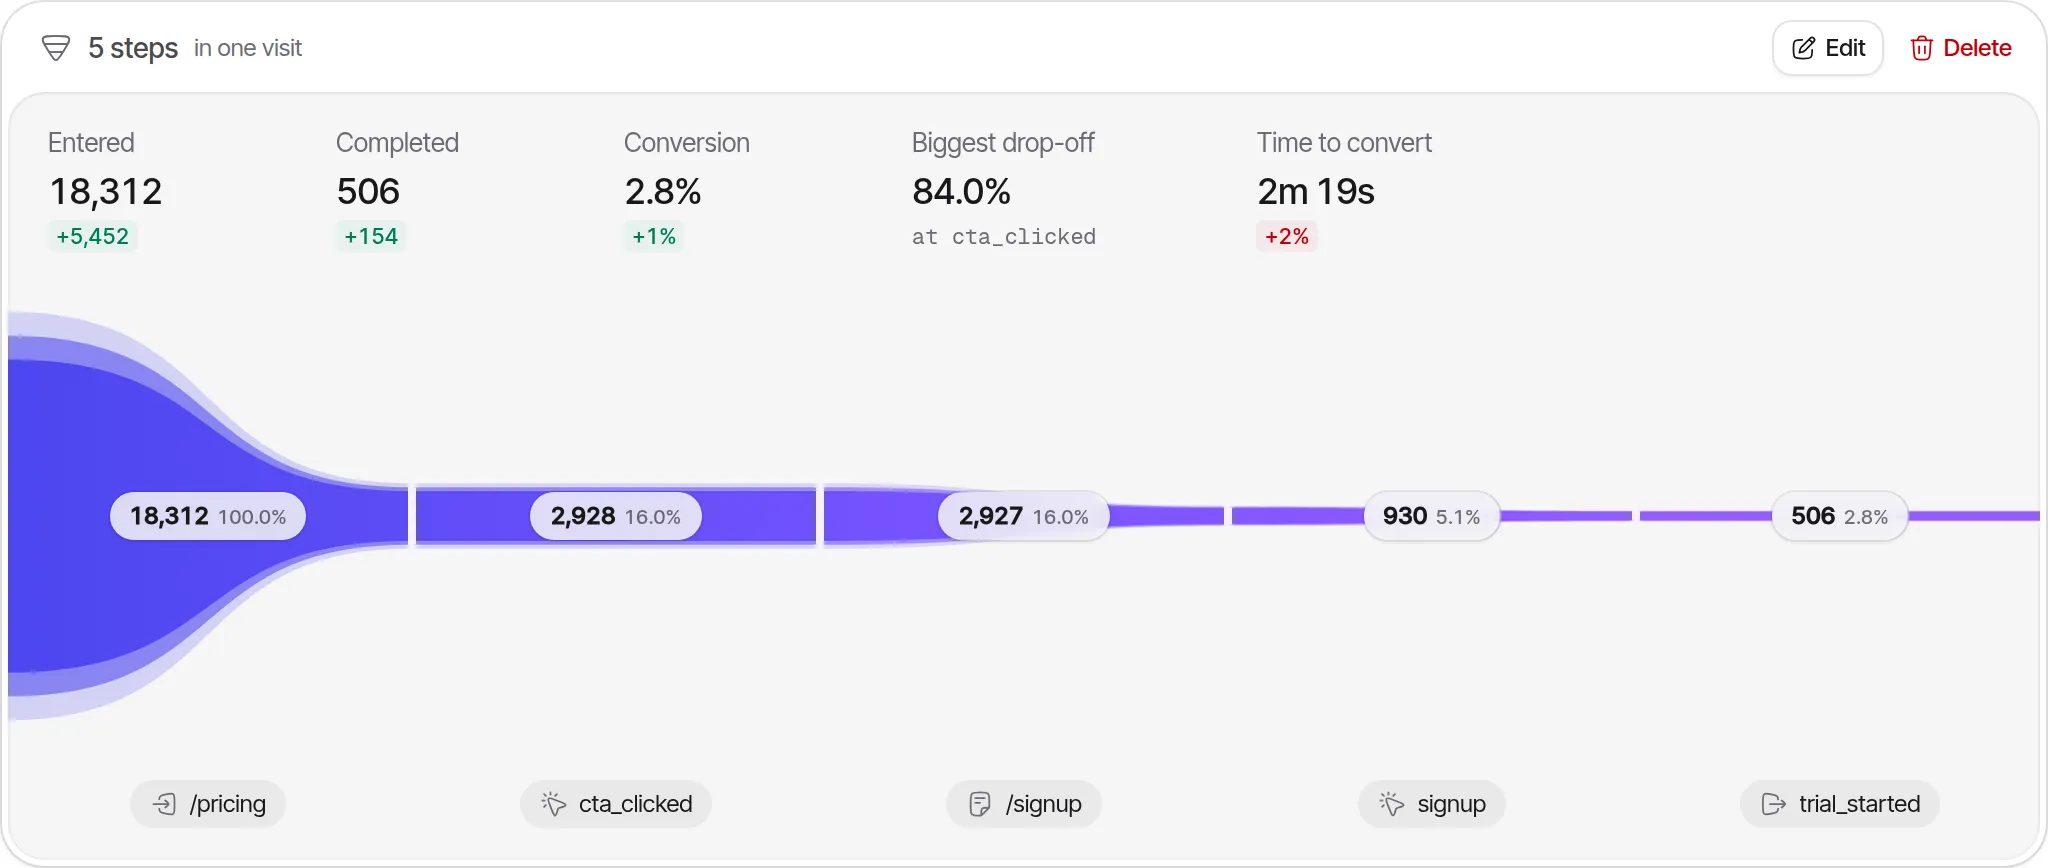
The trade-off is the one the test shows. invisit tells you what share of visits that reached a step finished in that sitting, and loses anyone who returns later or steps away for more than 30 minutes, like Gus and Kai. That fits a signup form or a checkout. For journeys over days or weeks, Mixpanel, Amplitude or PostHog measure what invisit cannot, at the price of an identifier stored on the device.
How to compare funnel numbers between two tools
Make the definitions match before you compare rates:
- Write down each tool’s unit, time limit, entry rule and order for the funnel, using the table above.
- Check that the steps match the same hits: the same paths with the same trailing slash, and the same event, sent once.
- Align the unit. Against a visit-based tool such as invisit or Matomo, use Mixpanel’s Sessions counting method, or hold Session ID constant in Amplitude. Compare user-based tools with each other.
- Align the window. Set the tool with the longer limit to the shorter one, where the setting exists.
- Keep both funnels closed and in loose order, unless the question needs another mode.
- Use the same time zone and a range several times longer than the window, and leave out the final days the window has not covered yet.
- Compare step counts before rates. If the entries at step 1 differ by more than your traffic does, the units still differ.
The trap to avoid is putting an open GA4 funnel’s numbers next to a closed funnel’s conversion rate. An open funnel adds people at later steps, so its last step divided by its first can pass 100% and compares with nothing.